Find bottlenecks earlier
Separate scheduled, completed, and unscheduled demand instead of waiting for anecdotal office updates.
Manage the pipeline
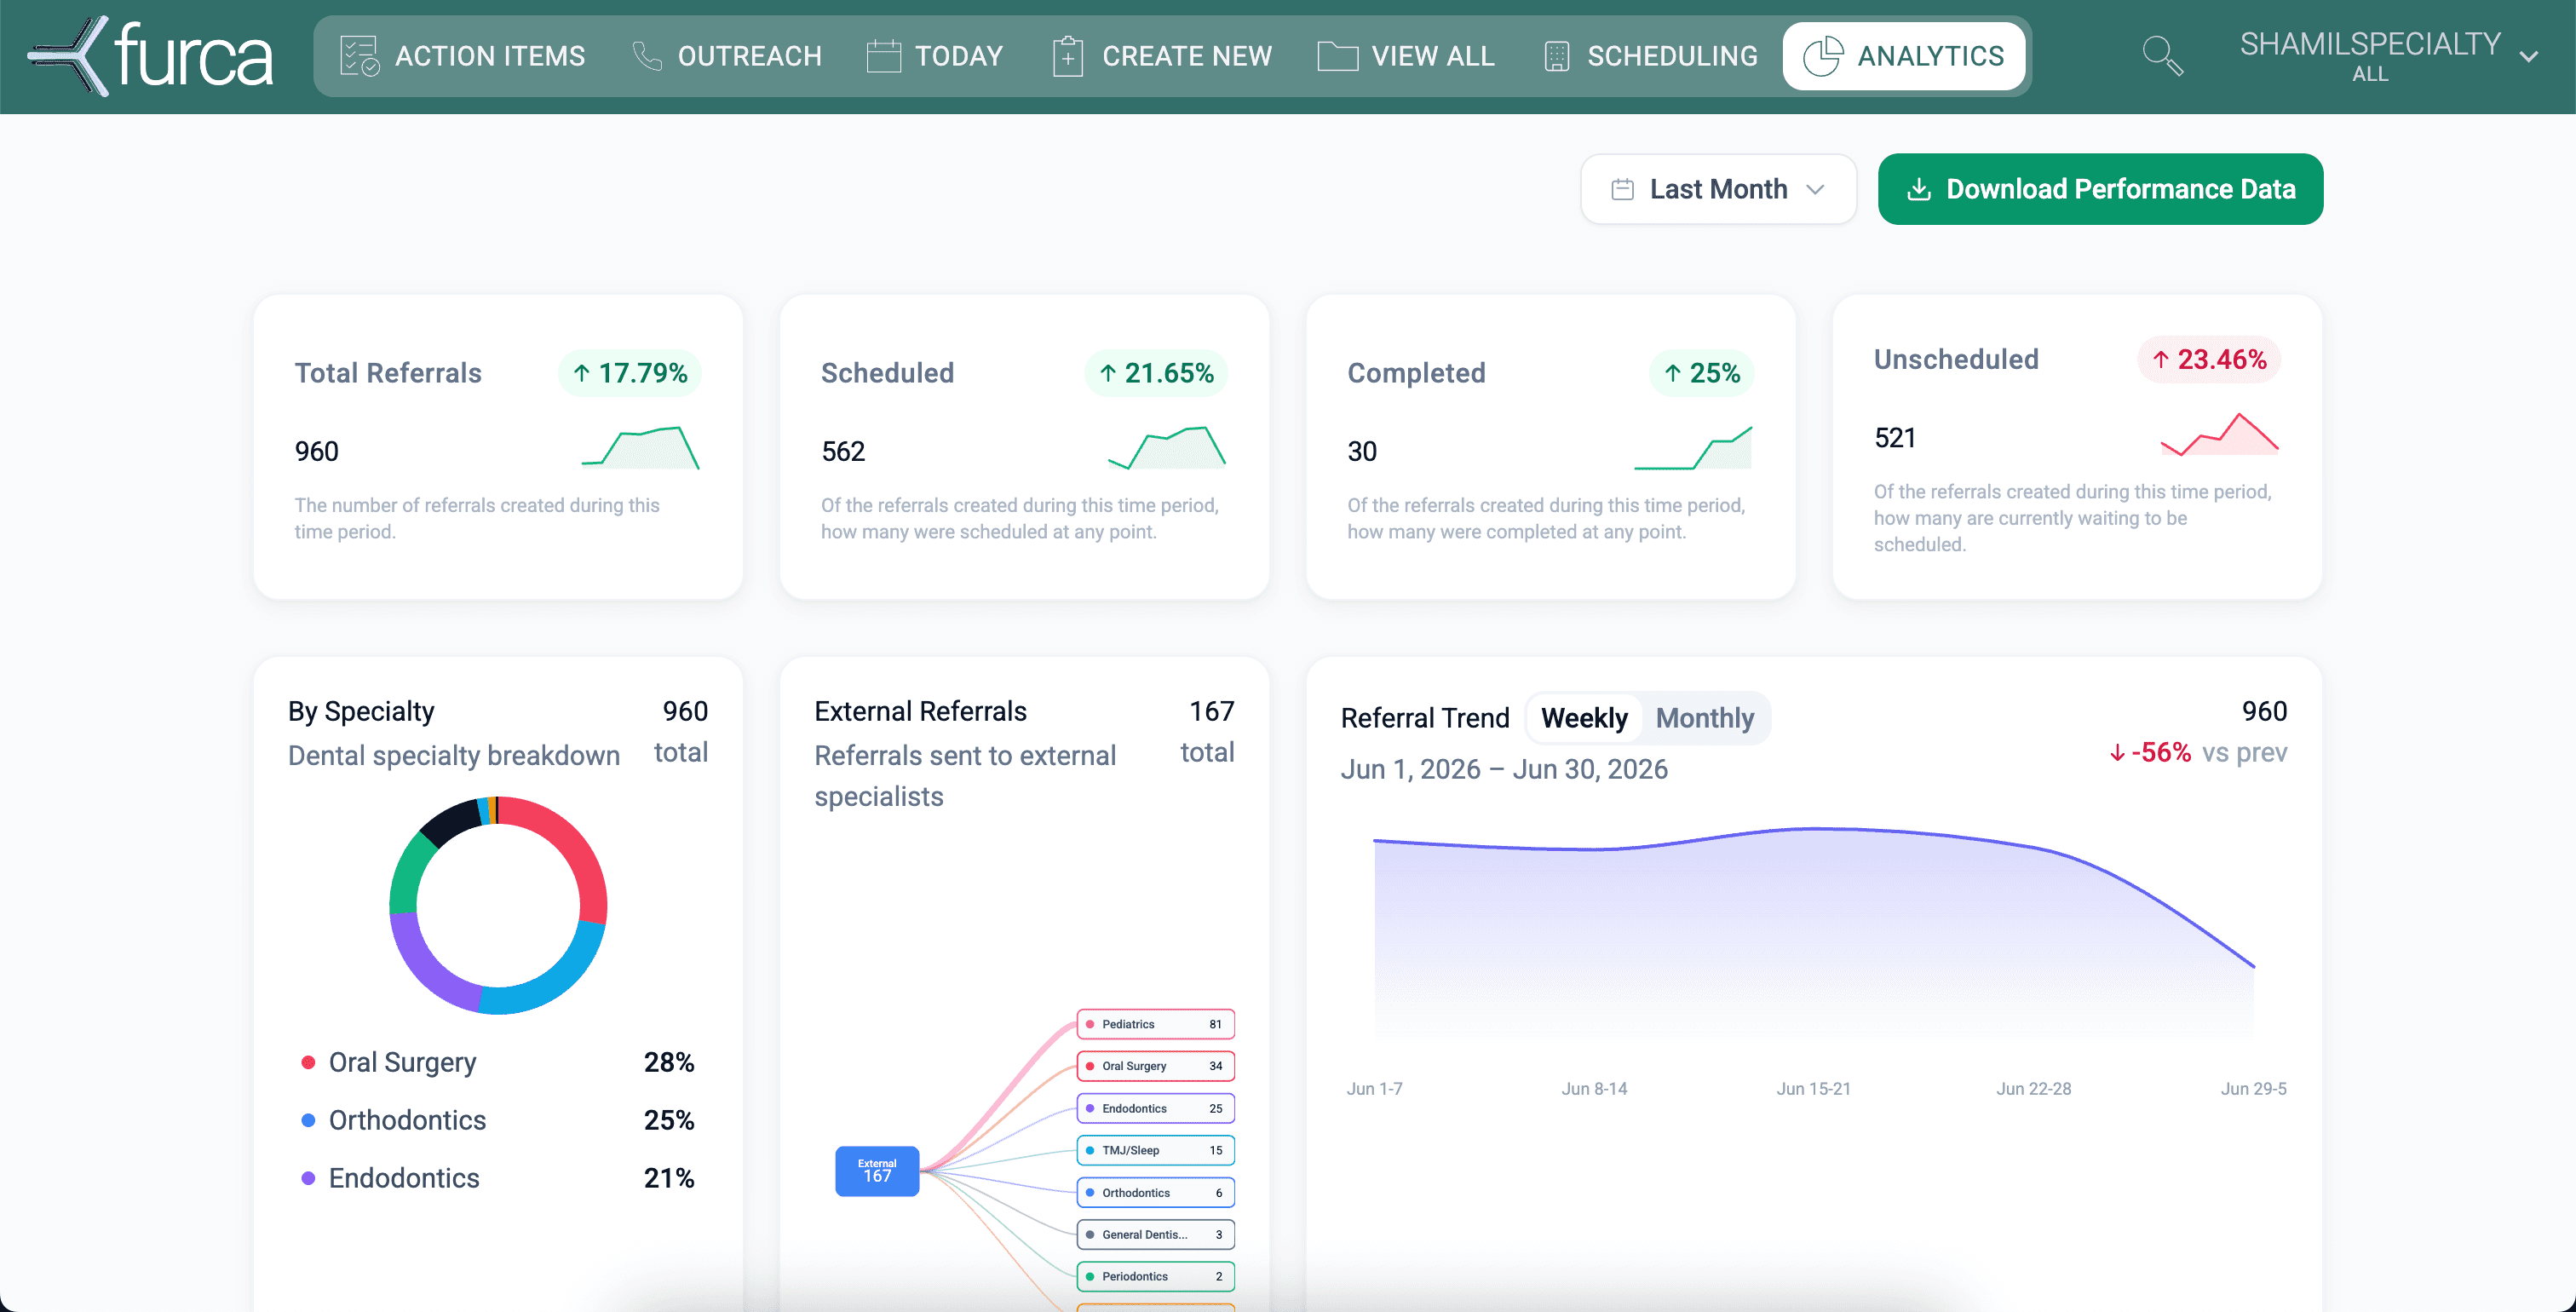
See referral volume, scheduled and completed outcomes, unscheduled demand, and performance trends across locations and specialties.
The executive value
Furca turns referral activity into a DSO-wide view of where demand is moving, where it is stuck, and where the operating model needs attention.
Separate scheduled, completed, and unscheduled demand instead of waiting for anecdotal office updates.
Review performance by location, provider, and specialty with consistent definitions across the organization.
Use referral volume and outcome trends to inform where specialty days and operational support may be needed.
How it works
The dashboard is built from the referral workflow itself, so leadership can investigate an operating question without first assembling another spreadsheet.
Creation, scheduling, completion, and other workflow events build the operating record.
Filter the pipeline by date, specialty, location, provider, and outcome.
Use unscheduled demand and performance differences to focus the next operational conversation.
What teams can do
Capability 1
Review total, scheduled, completed, and unscheduled referrals for the selected period.
See the status of the pipeline before drilling into detail.
Capability 2
Compare referral patterns by location, provider, and specialty.
Identify meaningful differences without relying on local spreadsheets.
Capability 3
Download performance data for deeper analysis and leadership reporting.
Report context and units travel with the exported tables.
Customer evidence
See how Two Rivers used referral data to identify unscheduled demand and make specialty-capacity decisions.
Questions
The dashboard reports referral volume and workflow outcomes such as scheduled, completed, and unscheduled referrals, with views by date, location, provider, and specialty.
Analytics are based on events recorded through the Furca referral workflow, including referral creation, status changes, scheduling, and completion activity.
Yes. Furca supports downloadable performance reports for leadership analysis and operating reviews.
We’ll map your current handoffs, show the relevant Furca workflow, and identify the operating measures your team should validate.